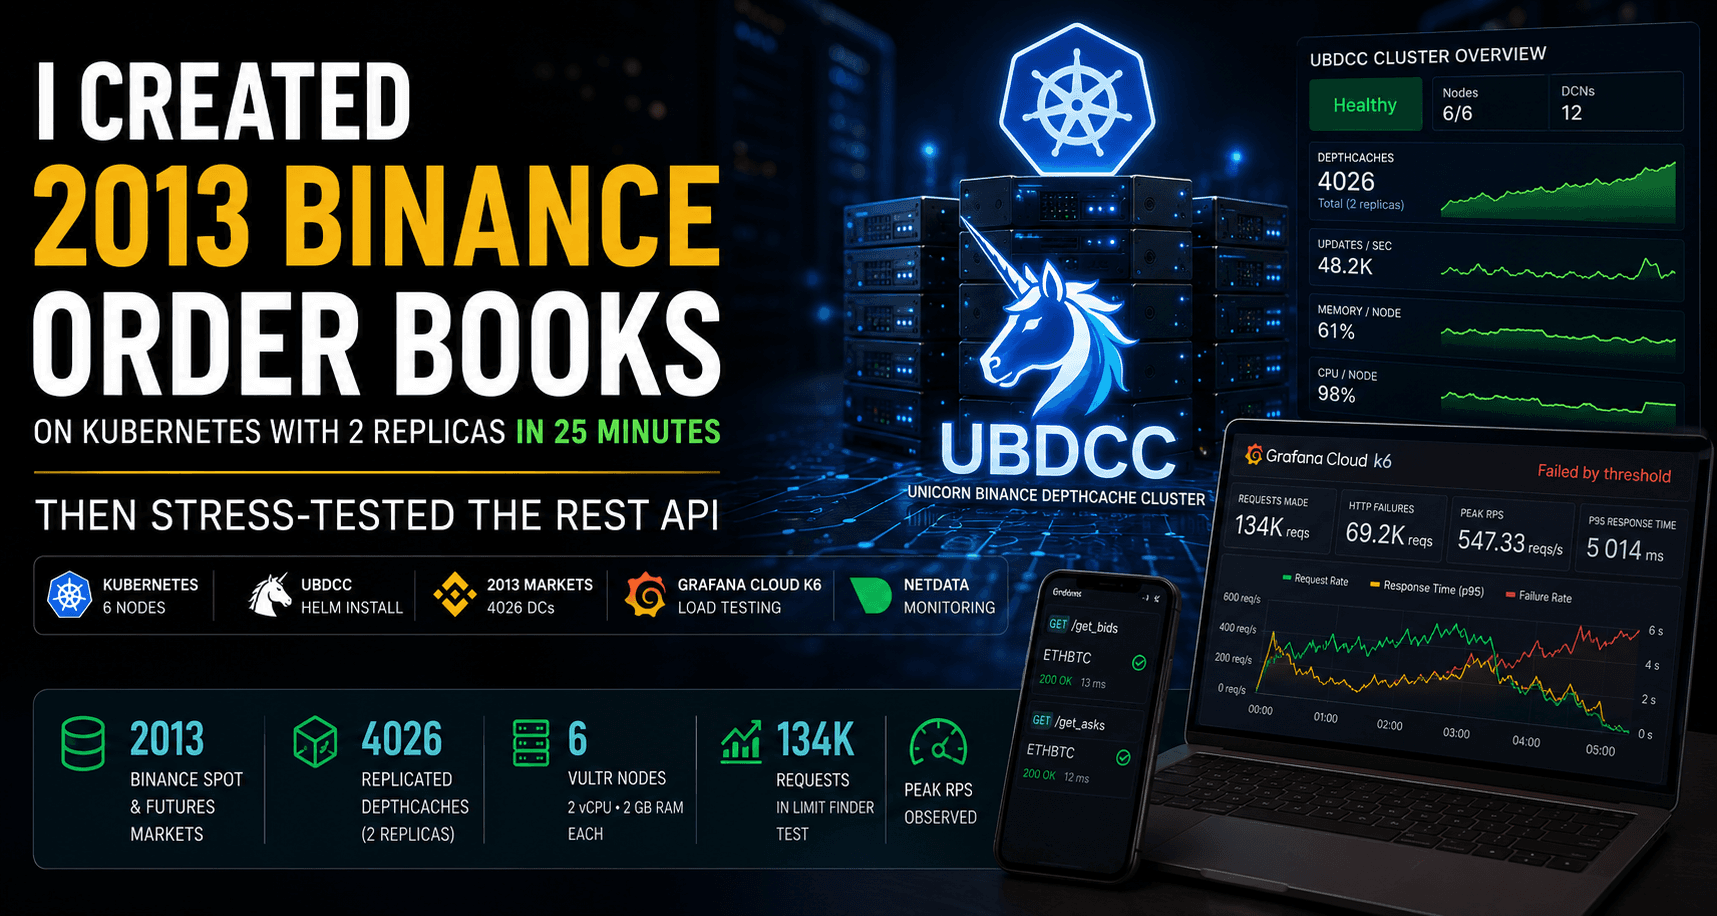
I Created 2013 Binance Order Books on Kubernetes with 2 Replicas in 25 Minutes — Then Stress-Tested the REST API
Using UBDCC on six low-cost Vultr nodes to synchronize 4026 replicated Binance Spot and Futures DepthCaches, monitor the cluster, and push the REST API with Grafana Cloud k6.
This is not a theoretical architecture article.
This is a practical infrastructure test.
The goal was simple:
Can I create all active Binance Spot and Futures order books as replicated Kubernetes infrastructure, expose them through REST, monitor the cluster, and then load-test the API until the setup starts to bend?
What this article covers
In this article, I walk through the full test setup:
creating a Kubernetes cluster on Vultr
installing UBDCC with Helm
creating a first manual Binance DepthCache
installing fast live monitoring with Netdata
creating 2013 active Binance Spot and Futures DepthCaches
running Grafana Cloud k6 smoke, ramp, hot-market, distributed-market and limit-finder tests
comparing single-market hot-path behavior with distributed cluster behavior
documenting the bottlenecks, failures, and measurement traps
The final setup used:
Provider:      Vultr Kubernetes
Nodes:         6 low-cost nodes
UBDCC:         Helm installation
DCNs:          dcn.coresPerNode=2
Markets:       2013 Binance Spot + Futures markets
Replicas:      2 per market
DepthCaches:   4026 replicated DepthCaches
Monitoring:    Netdata + kubectl top
Load testing:  Grafana Cloud k6
Important: This test does not stress Binance. Binance is only the public market-data source. The actual load test targets the UBDCC REST API running on my Kubernetes cluster.
Related background
If you want to try UBDCC locally first, without Kubernetes, start with the quickstart:
From pip install to a Redundant Binance Order Book Cluster — UBDCC + Dashboard Quickstart
That article shows the fastest local path with pip install, ubdcc start, the dashboard, and a first local DepthCache before moving to the Kubernetes version.
This article builds on my previous UBDCC Kubernetes installation guide:
Install UBDCC on Kubernetes with Helm: A Redundant Binance Order Book Cluster in 20 Minutes
That guide covers the base setup in detail: creating the Kubernetes cluster, installing kubectl and Helm, deploying UBDCC, finding the REST API IP, creating a first DepthCache and querying bids and asks.
If you specifically want to reproduce the Vultr setup, start here:
Vultr setup section
For the architectural background behind UBDCC, replicated DepthCaches, failover and why order book correctness matters, read the deep dive:
UBDCC Deep-Dive: Building a Trust Layer for Binance Order Books
What is UBDCC?
UBDCC stands for UNICORN Binance DepthCache Cluster.
The idea behind UBDCC is to move Binance order book state out of individual bots and into shared infrastructure.
Usually, every trading bot, analytics tool, or strategy service builds and maintains its own local Binance order book.
That means every application has to deal with:
WebSocket stream handling
REST snapshot loading
reconnects
update ID continuity
out-of-sync detection
local cache correctness
failover
resync behavior
duplicate infrastructure logic
UBDCC turns that around.
Instead of every bot maintaining its own fragile local order book, UBDCC runs the order book infrastructure once and exposes synchronized DepthCaches over REST.
Clients can then simply query:
/get_asks
/get_bids
That makes the order book infrastructure reusable.
But it also raises a new question:
How much REST traffic can this infrastructure handle?
That is what this test is about.
For the deeper architecture and trust-layer reasoning, see:
UBDCC Deep-Dive: Building a Trust Layer for Binance Order Books
Test goal
The goal was not to produce a synthetic vanity benchmark.
The goal was to find useful operational signals:
How fast can the cluster create and synchronize thousands of DepthCaches?
How much REST load can a single hot market handle?
How much REST load can the cluster handle when requests are distributed across many markets?
Where do p95 and p99 latencies start rising?
When do timeouts appear?
Are errors caused by load, invalid markets, timeouts, or the measurement system?
Does adding more REST API pods move the bottleneck?
How much can the cheapest Kubernetes nodes handle?
The interesting number is not the highest request rate that appears for one second.
The interesting number is the highest load where latency, error rate and replica health remain stable.
Video walkthrough
I also recorded a full Kubernetes setup video for this UBDCC cluster.
The video does not rerun the paid Grafana Cloud k6 stress test. Instead, it shows the reproducible setup path: creating the Kubernetes cluster, installing UBDCC with Helm, opening the dashboard, creating a first DepthCache with curl, and creating all currently active Binance Spot and Futures DepthCaches with replicas.
The stress-test results themselves are documented in this article below.
https://www.youtube.com/watch?v=erxIkwmqlmk
Test environment
Kubernetes cluster
I used six low-cost Vultr Kubernetes nodes.
This was intentionally not a high-end cluster.
The goal was to test what the cheapest useful Kubernetes infrastructure can do.
Four nodes would likely already be enough to run all active Binance Spot and Futures markets with replication. I used six nodes to speed up synchronization and to leave more room for the stress test.
Nodes:     6
Node type: Vultr Regular Cloud Compute
Price:     \(15/month per node (\)90/month total for 6 nodes)
CPU:       2 vCPU per node
Memory:    2024 MB RAM per node
Purpose:   low-cost baseline test
In total, the worker pool provided 12 vCPUs and roughly 12 GB RAM.
This is important for interpreting the results: the test used cheap general-purpose nodes, not high-performance or CPU-optimized instances. The measured REST API limits should therefore be understood as the limits of this low-cost cluster configuration, not as an upper bound of UBDCC itself.
For the detailed Vultr walkthrough, including screenshots and kubeconfig setup, see the Vultr section of the Kubernetes installation guide:
Vultr setup section

No Binance API credentials
No Binance API credentials were used.
The complete test uses public Binance market data only.
This is important because the test does not require:
account access
API keys
secrets
trading permissions
private user data
It only works with public order book data.
Installing UBDCC on Kubernetes
This section is a compact summary of the setup used for this stress test.
For the complete step-by-step installation article, including Vultr screenshots and the first UBDCC REST calls, see:
Install UBDCC on Kubernetes with Helm: A Redundant Binance Order Book Cluster in 20 Minutes
Download kubeconfig
After creating the Kubernetes cluster in the Vultr Console, download the kubeconfig and place it locally.
Example:
mkdir -p ~/.kube
cp ./vke-cf9c45cc-1cfc-4c59-9550-dc1bb68f3090.yaml ~/.kube/config
Then verify access:
kubectl get nodes
Expected:
NAME                      STATUS   ROLES    AGE   VERSION
ubdcc-node-...            Ready    <none>   ...
...

Install the Metrics Server
The Kubernetes Metrics Server is useful for quick resource checks with kubectl top.
kubectl apply -f https://github.com/kubernetes-sigs/metrics-server/releases/latest/download/components.yaml
Check node metrics:
kubectl top nodes
After installing the Metrics Server, it can take a few minutes until the Metrics API becomes available.
If you get this error:
error: Metrics API not available
wait about 5 minutes and try again:
kubectl top nodes

Check UBDCC pod metrics later:
kubectl top pods -n ubdcc
For live monitoring during the test:
watch -n 2 kubectl top nodes
watch -n 2 kubectl top pods -n ubdcc
watch -n 2 kubectl get pods -n ubdcc -o wide
Add the UBDCC Helm repository
helm repo add ubdcc https://oliver-zehentleitner.github.io/unicorn-binance-depth-cache-cluster/helm
helm repo update
Install UBDCC
helm install ubdcc ubdcc/ubdcc \
  --namespace ubdcc \
  --create-namespace \
  --set dcn.coresPerNode=2
The important setting here is:
dcn.coresPerNode=2
DCN means DepthCache Node.
The DCNs are the UBDCC components that manage the actual Binance DepthCaches.
With six Kubernetes nodes and dcn.coresPerNode=2, the cluster gets enough DCN capacity to distribute thousands of DepthCaches.
Check the installation:
kubectl get pods -n ubdcc -o wide
kubectl get svc -n ubdcc
kubectl describe services ubdcc-restapi -n ubdcc

Get the public UBDCC REST API IP address:
kubectl get svc -n ubdcc

Use the external IP of the UBDCC REST API service for the following curl and k6 tests. Replace [YOUR_UBDCC_IP] with that IP.
First REST smoke test with one DepthCache
Before creating all markets, I first created one DepthCache manually.
This is the same basic check shown in the installation guide:
Install UBDCC on Kubernetes with Helm: A Redundant Binance Order Book Cluster in 20 Minutes
Create ETHBTC with two replicas
Linux/macOS:
curl 'http://[YOUR_UBDCC_IP]/create_depthcache?exchange=binance.com&market=ETHBTC&desired_quantity=2'
Windows:
curl.exe "http://[YOUR_UBDCC_IP]/create_depthcache?exchange=binance.com&market=ETHBTC&desired_quantity=2"
desired_quantity=2 means that UBDCC should maintain two replicas of this DepthCache.
That is important for failover and redundancy.
Query asks
Linux/macOS:
curl 'http://[YOUR_UBDCC_IP]/get_asks?exchange=binance.com&market=ETHBTC&limit_count=100'
Windows:
curl.exe "http://[YOUR_UBDCC_IP]/get_asks?exchange=binance.com&market=ETHBTC&limit_count=100"
Query bids
Linux/macOS:
curl 'http://[YOUR_UBDCC_IP]/get_bids?exchange=binance.com&market=ETHBTC'
Windows:
curl.exe "http://[YOUR_UBDCC_IP]/get_bids?exchange=binance.com&market=ETHBTC"
The parameter limit_count=100 limits the response to the first 100 price levels.
For load testing, that is useful because response size and network traffic stay more predictable.
Monitoring with Netdata
For this test, I wanted a fast live view of the cluster.
I did not need long-term retention, alerting, or a full Prometheus/Grafana monitoring stack.
I mainly needed:
Node CPU
Node memory
Network receive/transmit
Disk I/O
Load
Container utilization
For that, Netdata was the fastest path.
Install Netdata
Use a separate namespace:
kubectl create namespace netdata
Add the Helm repo:
helm repo add netdata https://netdata.github.io/helmchart/
helm repo update
Install Netdata without persistence:
helm install netdata netdata/netdata \
  --namespace netdata \
  --set parent.database.persistence=false \
  --set parent.alarms.persistence=false \
  --set k8sState.persistence.enabled=false
Persistence is disabled because this setup is only used for live monitoring during the test. No long-term metric storage is required.
Without disabling persistence, the Netdata parent and k8s-state pods may remain pending if the cluster does not have a suitable default StorageClass.
The symptom looks like this:
pod has unbound immediate PersistentVolumeClaims

Check Netdata:
kubectl get pods -n netdata -o wide
kubectl get svc -n netdata
Expected:
6 netdata-child pods
1 netdata-parent pod
1 netdata-k8s-state pod

Open the Netdata UI
kubectl port-forward -n netdata svc/netdata 19999:19999
Then open:
http://localhost:19999
Connect the Netdata UI
If the Netdata UI asks for the netdata_random_session_id, the command must be executed inside the Netdata parent pod, not on your local machine.
First get the parent pod name:
kubectl get pods -n netdata
Look for the pod named similar to:
netdata-parent-5b7fcf845d-qhw8k
Then read the session ID from the parent pod:
kubectl exec -n netdata -it <NETDATA_PARENT_POD> -- sh -c 'chmod u+r /var/lib/netdata/netdata_random_session_id && cat /var/lib/netdata/netdata_random_session_id'
Example:
kubectl exec -n netdata -it netdata-parent-5b7fcf845d-qhw8k -- sh -c 'chmod u+r /var/lib/netdata/netdata_random_session_id && cat /var/lib/netdata/netdata_random_session_id'
Do not run this command on your local machine. The file exists inside the Netdata parent pod.

This step is only needed if the Netdata UI asks you to connect or claim the node. For local live monitoring through port-forwarding, Netdata can also be used without connecting it to Netdata Cloud.
Creating all Binance Spot and Futures DepthCaches
After the single ETHBTC smoke test worked, I created all active Binance Spot and Futures DepthCaches.
The target was:
2013 markets
2 replicas each
4026 replicated DepthCaches
This was done with helper scripts:
ubdcc_create_all_spot_depthcaches.py
https://gist.github.com/oliver-zehentleitner/17835e6e4bf732ce67f7bbbb2a282a41
ubdcc_create_all_futures_depthcaches.py
https://gist.github.com/oliver-zehentleitner/e0c55876d5c80d06ebf1e36409f94152
ubdcc_asks_from_all_depthcaches.py
https://gist.github.com/oliver-zehentleitner/f06b52294f274b058ea651847d96a910
ubdcc_bids_from_all_depthcaches.py
https://gist.github.com/oliver-zehentleitner/ea3cf73df07dbc3fc0f618fae81ff659
ubdcc_test_all_depthcaches.py
https://gist.github.com/oliver-zehentleitner/60db3f73eca3fd35a206570511b85ad0
ubdcc_stop_all_depthcaches.py
https://gist.github.com/oliver-zehentleitner/9421166ce95e9a285beaaca238875010
The first two scripts create all Spot and Futures DepthCaches.

Now we have to wait until all DCs, including replicas, are synchronized. It took 25 minutes for me.
The cluster successfully synchronized 4026 replicated DepthCaches across Binance Spot and Futures markets.

That was already an important result.
The installation itself is fast.
The more interesting question is what happens after the cluster is full.
Load testing with Grafana Cloud k6
The load generator should not be my laptop.
If I generate load locally, I may end up measuring:
my laptop
my local network
my ISP
local OS limits
I wanted the load generator to be external and reproducible.
So I used Grafana Cloud k6.
Test types
I used four Grafana Cloud k6 tests because one single benchmark number would be misleading.
The tests were executed from the Frankfurt load zone because the UBDCC Kubernetes cluster was also running in Frankfurt.
That matters.
The previous test runs from Columbus included unnecessary WAN latency. For the final article results, I wanted the load generator to be geographically close to the cluster so the measurements focus more on the UBDCC REST API and Kubernetes setup itself.
Load zone: Frankfurt
UBDCC cluster location: Frankfurt
I also removed Netdata before running the final k6 tests.
Netdata was very useful during cluster setup and DepthCache synchronization, but monitoring is not free. During the synchronization phase, Netdata used roughly 5–15% CPU per node. After capturing the useful monitoring screenshots, I removed it again to get cleaner REST API load-test results.
The final k6 tests therefore measure the UBDCC cluster without the additional Netdata monitoring overhead.
Why multiple tests?
There are two very different load patterns:
Hot-market load
Many requests hit one market, for exampleETHBTC.Distributed-market load
Requests are spread across all running Binance Spot and Futures DepthCaches.
That distinction matters.
A single hot market with desired_quantity=2 mainly stresses the two replicated DepthCaches for that market and the DCNs hosting those replicas.
A distributed-market test spreads requests across many markets, many DepthCaches, many DCNs and multiple Kubernetes nodes.
So the tests below answer different questions.
Hot-market test:
How much load can one heavily requested market handle?

Distributed-market test:
How much load can the cluster handle when requests are spread across many markets?
Test 1: Smoke test
The first test is only a reachability and correctness check.
It verifies that Grafana Cloud k6 can reach the public UBDCC REST API and that basic /get_asks and /get_bids requests return valid responses.
This test targets one market, defaults to ETHBTC, and runs at a very small request rate.
https://gist.github.com/oliver-zehentleitner/09d10222acffec3959e28f4c52ae80cf
What this test checks
Target:     one market
Default:    ETHBTC
Endpoints:  /get_asks and /get_bids
Rate:       10 requests/second
Duration:   1 minute
Purpose:    verify reachability before larger tests
Load zone:  Frankfurt
Result

Requests:        601
HTTP failures:   0
Peak RPS:        10 req/s
Average RPS:     8.59 req/s
p95:             44 ms
Checks:          1.2K / 1.2K
Thresholds:      2 / 2 passed
VUs:             100 max
VUH:             1.67
Result:          Good
Interpretation
The smoke test completed cleanly.
Grafana Cloud k6 reached the public UBDCC REST API from the Frankfurt load zone, sent 601 requests, and received zero HTTP failures.
All checks passed, and the p95 response time was 44 ms.
That confirms the basic path:
Grafana Cloud k6 Frankfurt
→ Vultr LoadBalancer
→ UBDCC REST API
→ ETHBTC DepthCache
This is not a stress test yet.
It only proves that the external load generator can reach the cluster and that the REST API responds correctly.
Test 2: Distributed dynamic market plateau test
The second test is the first real distributed cluster test.
Instead of hardcoding one market, the script calls:
/get_depthcache_list
It then builds a list of usable DepthCaches and randomly selects a market for every request.
The test only uses running DepthCaches and filters out non-ASCII market symbols. This avoids measuring invalid market names or URL validation behavior instead of REST API performance.
https://gist.github.com/oliver-zehentleitner/dcc7d8b314c7ea81b8ffa8760e67d261
What this test checks
Target:     all running ASCII DepthCaches
Endpoints:  /get_asks and /get_bids
Pattern:    ramp into plateau
Purpose:    validate sustained distributed REST API load
Load zone:  Frankfurt
Why this test matters
This test is much closer to the actual cluster use case.
The load is distributed across many markets, many replicated DepthCaches, many DCNs and multiple Kubernetes nodes.
It answers a different question than the hot-market test:
Hot-market test:
How much load can one heavily requested market handle?

Distributed plateau test:
How much sustained load can the cluster handle when requests are spread across many markets?
Result

Duration:        12 min
Requests:        105,401
HTTP failures:   0
Peak RPS:        370 req/s
Average RPS:     144.38 req/s
p95:             274 ms
Checks:          306.6K / 306.6K
Thresholds:      3 / 3 passed
VUs:             1000 max
VUH:             180
Result:          Finished
Load zone:       Frankfurt
Interpretation
The distributed plateau test completed cleanly.
It sent 105,401 requests across dynamically selected running DepthCaches and reached 370 peak requests per second.
There were:
0 HTTP failures
0 failed checks
3 / 3 thresholds passed
The p95 response time was 274 ms.
This is the strongest stable baseline result from the final test set.
It shows that the low-cost six-node cluster can serve distributed REST API traffic across thousands of replicated DepthCaches without HTTP failures at this load level.
This does not mean every request is always equally fast. Some individual markets showed higher latency, but the aggregate result stayed healthy.
The important point is:
Distributed load across many markets behaved much better than hot-market load against one market.
Test 3: Hot-market ramp test
The third test intentionally stresses one single market.
This is not a full-cluster test.
It is a hot-path test.
With desired_quantity=2, one market is replicated twice. That means a hot-market test mainly stresses the two DepthCache replicas for that market and the DCNs hosting those replicas.
https://gist.github.com/oliver-zehentleitner/82e407955b3c09ca25382069bf5cd5fa
What this test checks
Target:     one market
Default:    ETHBTC
Endpoints:  /get_asks and /get_bids
Pattern:    ramping arrival rate
Stages:     25 → 50 → 100 → 250 → 500 RPS
Purpose:    identify the degradation point of one hot replicated market
Load zone:  Frankfurt
Why this matters
A single hot market behaves differently from distributed market access.
If every request targets the same market, the full cluster is not used evenly. The bottleneck may be the replicated DepthCache path for that market, not the whole Kubernetes cluster.
In this test, that is intentional.
It answers the question:
What happens when one market becomes hot?
Result

Duration:        5 min 30 sec
Requests:        38,903
HTTP failures:   7,939
Failure rate:    19%
Peak RPS:        300 req/s
Average RPS:     114.42 req/s
p95:             5006 ms
Checks:          66.1K / 82K
Check pass rate: ~80.6%
Thresholds:      0 / 2 passed
VUs:             1000 max
VUH:             91.67
Result:          Failed by threshold
Load zone:       Frankfurt
The failed thresholds were:
http_req_failed rate<0.01
measured: 0.19

http_req_duration p(95)<1000
measured: 5006 ms
Interpretation
The hot-market ramp failed by threshold.
That is useful.
At around 300 peak requests per second, the single-market hot path degraded heavily. The p95 response time reached roughly 5 seconds, which matches the configured request timeout range.
The important distinction:
This was not a full-cluster failure.
This was a hot-path failure for one replicated market.
With ETHBTC and desired_quantity=2, the test mainly stresses two replicas and the DCNs hosting those replicas.
That explains why the distributed plateau test could reach 370 peak RPS with zero failures, while this hot-market test reached 300 peak RPS with 19% HTTP failures.
The hot-market test shows that one heavily requested market can become a bottleneck much earlier than the cluster as a whole.
Test 4: Distributed dynamic fast limit finder
The fourth and final test was the aggressive one.
It used the distributed dynamic market approach again, but ramped much faster and higher than the plateau test.
The goal was not to prove a stable operating point.
The goal was to find where the low-cost cluster starts to degrade.
https://gist.github.com/oliver-zehentleitner/01635ac085ddee4b066481f9751f864e
What this test checks
Target:     all running ASCII DepthCaches
Endpoints:  /get_asks and /get_bids
Pattern:    fast ramp
Stages:     300 → 500 → 700 → 900 → 1100 RPS
Purpose:    find the degradation point faster
Load zone:  Frankfurt
Why low-cardinality tags matter
For large distributed tests across thousands of markets, the market tag must not be emitted as a k6 metric tag.
Otherwise, every market creates additional time series.
Even without an explicit market tag, the default url system tag can create high cardinality because each request URL contains a different market symbol.
The low-cardinality version still randomly queries all markets, but aggregates the metrics by endpoint and exchange instead of by individual market.
This avoids hitting Grafana Cloud k6's time-series cardinality limit while still distributing the actual REST requests across all markets.
Kubernetes node usage during the test
During this run, the Kubernetes nodes reached heavy CPU pressure.
Example snapshots from kubectl top nodes during the test:
NAME                            CPU(cores)   CPU(%)   MEMORY(bytes)   MEMORY(%)
regular-2cpu-2gb-18dea39af28e   1119m        62%      1114Mi          63%
regular-2cpu-2gb-259bd481f6aa   1447m        80%      1018Mi          57%
regular-2cpu-2gb-3e6ac20be264   1142m        63%      1195Mi          67%
regular-2cpu-2gb-4d0409e8f8a6   1153m        64%      1047Mi          59%
regular-2cpu-2gb-868449529f74   1159m        64%      1140Mi          64%
regular-2cpu-2gb-f690b769ee94   1292m        71%      1018Mi          57%
Later in the same test:
NAME                            CPU(cores)   CPU(%)   MEMORY(bytes)   MEMORY(%)
regular-2cpu-2gb-18dea39af28e   1970m        109%     1131Mi          64%
regular-2cpu-2gb-259bd481f6aa   1993m        110%     1030Mi          58%
regular-2cpu-2gb-3e6ac20be264   1998m        111%     1184Mi          67%
regular-2cpu-2gb-4d0409e8f8a6   1941m        107%     1058Mi          60%
regular-2cpu-2gb-868449529f74   1992m        110%     1148Mi          65%
regular-2cpu-2gb-f690b769ee94   1988m        110%     1022Mi          58%
Memory usage stayed moderate, mostly around 57–67%.
There were no pod restarts during this test, and the DepthCaches remained available.
That is important.
The failure mode was not memory exhaustion or cluster collapse.
The failure mode was request latency and timeout pressure under heavy CPU load.
Result

Duration:        5 min 30 sec
Requests:        134,032
HTTP failures:   69,156
Failure rate:    52%
Peak RPS:        547.33 req/s
Average RPS:     387.37 req/s
p95:             5014 ms
Checks:          194.6K / 402.1K
Thresholds:      0 / 3 passed
VUs:             2000 max
VUH:             166.66
Result:          Failed by threshold
Load zone:       Frankfurt
The failed thresholds were:
checks rate>0.95
measured: 0.48

http_req_failed rate<0.05
measured: 0.52

http_req_duration p(95)<5000
measured: 5014 ms
Interpretation
The fast limit finder found the degradation point very clearly.
At 547 peak requests per second, the cluster was still alive, all DepthCaches remained available, and there were no pod restarts.
But the REST API path was no longer able to answer reliably within the configured 5 second timeout.
This means:
The cluster did not crash.
The data infrastructure stayed available.
The REST API load exceeded the practical limit of this low-cost setup.
The observed behavior is consistent with CPU saturation and request queuing:
CPU pressure rises
requests queue
latency increases
5 second timeouts appear
thresholds fail
The practical interpretation:
~370 peak RPS distributed plateau: stable
~547 peak RPS fast limit finder: degraded heavily
This is exactly what the final test was supposed to reveal.
Test result summary
| Test | Purpose | Peak RPS | p95 | HTTP failures | Checks | Result |
|---|---|---|---|---|---|---|
| Smoke test | reachability | 10 | 44 ms | 0 | 1.2K / 1.2K | Passed |
| Distributed plateau | sustained distributed load | 370 | 274 ms | 0 | 306.6K / 306.6K | Passed |
| Hot-market ramp | one-market hot path | 300 | 5006 ms | 7,939 | 66.1K / 82K | Failed by threshold |
| Fast limit finder | degradation point | 547.33 | 5014 ms | 69,156 | 194.6K / 402.1K | Failed by threshold |
Final interpretation
The most important result is not a single RPS number.
The important result is the difference between the load patterns.
Distributed load behaved well
The distributed plateau test reached:
370 peak requests per second
274 ms p95
0 HTTP failures
all checks passing
That is the clean stable result.
It shows that the cluster can serve distributed REST traffic across the synchronized DepthCaches on six cheap Kubernetes nodes.
Hot-market load behaved very differently
The hot-market ramp reached:
300 peak requests per second
5006 ms p95
19% HTTP failure rate
That does not mean the whole cluster failed.
It means one replicated market became a hotspot.
That is expected behavior and an important operational distinction.
The fast limit finder showed the practical boundary
The fast limit finder pushed the distributed setup much harder.
It reached:
547.33 peak requests per second
5014 ms p95
52% HTTP failure rate
The Kubernetes nodes hit heavy CPU pressure, but memory stayed moderate and there were no pod restarts.
So the practical conclusion for this exact setup is:
The stable distributed operating area is below the aggressive limit-finder range.
Around 370 peak RPS was clean.
Above 500 peak RPS, the REST path degraded heavily on these low-cost nodes.
This should not be read as an upper limit of UBDCC itself.
This was a deliberately low-cost test setup:
6 × Vultr Regular Cloud Compute nodes
2 vCPU per node
2024 MB RAM per node
12 vCPU total
~12 GB RAM total
2013 markets
4026 replicated DepthCaches
A cluster with stronger single-core CPU performance, more REST API capacity, or more tuned resource limits should be able to push the numbers further.
But for the cheapest useful Kubernetes setup I tested, this was the practical result:
4026 replicated Binance DepthCaches synchronized successfully in 25 minutes.
Distributed REST reads were stable at hundreds of requests per second.
A single hot market degraded much earlier.
The cluster stayed alive under aggressive load, but the REST path timed out once CPU pressure became too high.
What I would test next
The next useful tests would be:
repeat the distributed plateau test on stronger CPU nodes
compare cheap Vultr nodes with CPU-optimized Vultr nodes
increase REST API replicas and isolate REST API capacity from DCN capacity
add explicit CPU requests and limits
test longer sustained plateaus
test a single hot market with more than 2 replicas
measure p99 and timeout behavior more aggressively
inspect REST API and DCN internals during high load
compare results with and without monitoring enabled
For this article, the key takeaway is already clear:
UBDCC can turn thousands of Binance order books into shared Kubernetes infrastructure, but load pattern matters. A single hot market and a distributed market workload are very different tests.
Call to action
If something in this test setup is unclear, missing, or does not work in your environment, please post it in the comments.
I am especially interested in real-world test results, different Kubernetes providers, different node sizes, higher REST API replica counts, alternative load-test designs, and better ways to visualize UBDCC behavior under load.
If something is useful for others too, I will try to pick it up and improve the article accordingly.
I hope you found this informative and useful.
Follow me on Binance Square, GitHub, Mastodon, X, and LinkedIn, or join Telegram for updates on my latest publications. Constructive feedback is always appreciated.
Thank you for reading, and happy coding! ¯\_(ツ)_/¯